← Back to work

Case 06 — Web app · Web3 analytics

Chain, community and growth data in one place — built for fast decisions.

Client
Thirdwave
Role
Lead Product Designer
Scope
Ranking · dapp detail · compare
Sector
Web3 · gaming
Status
Shipped
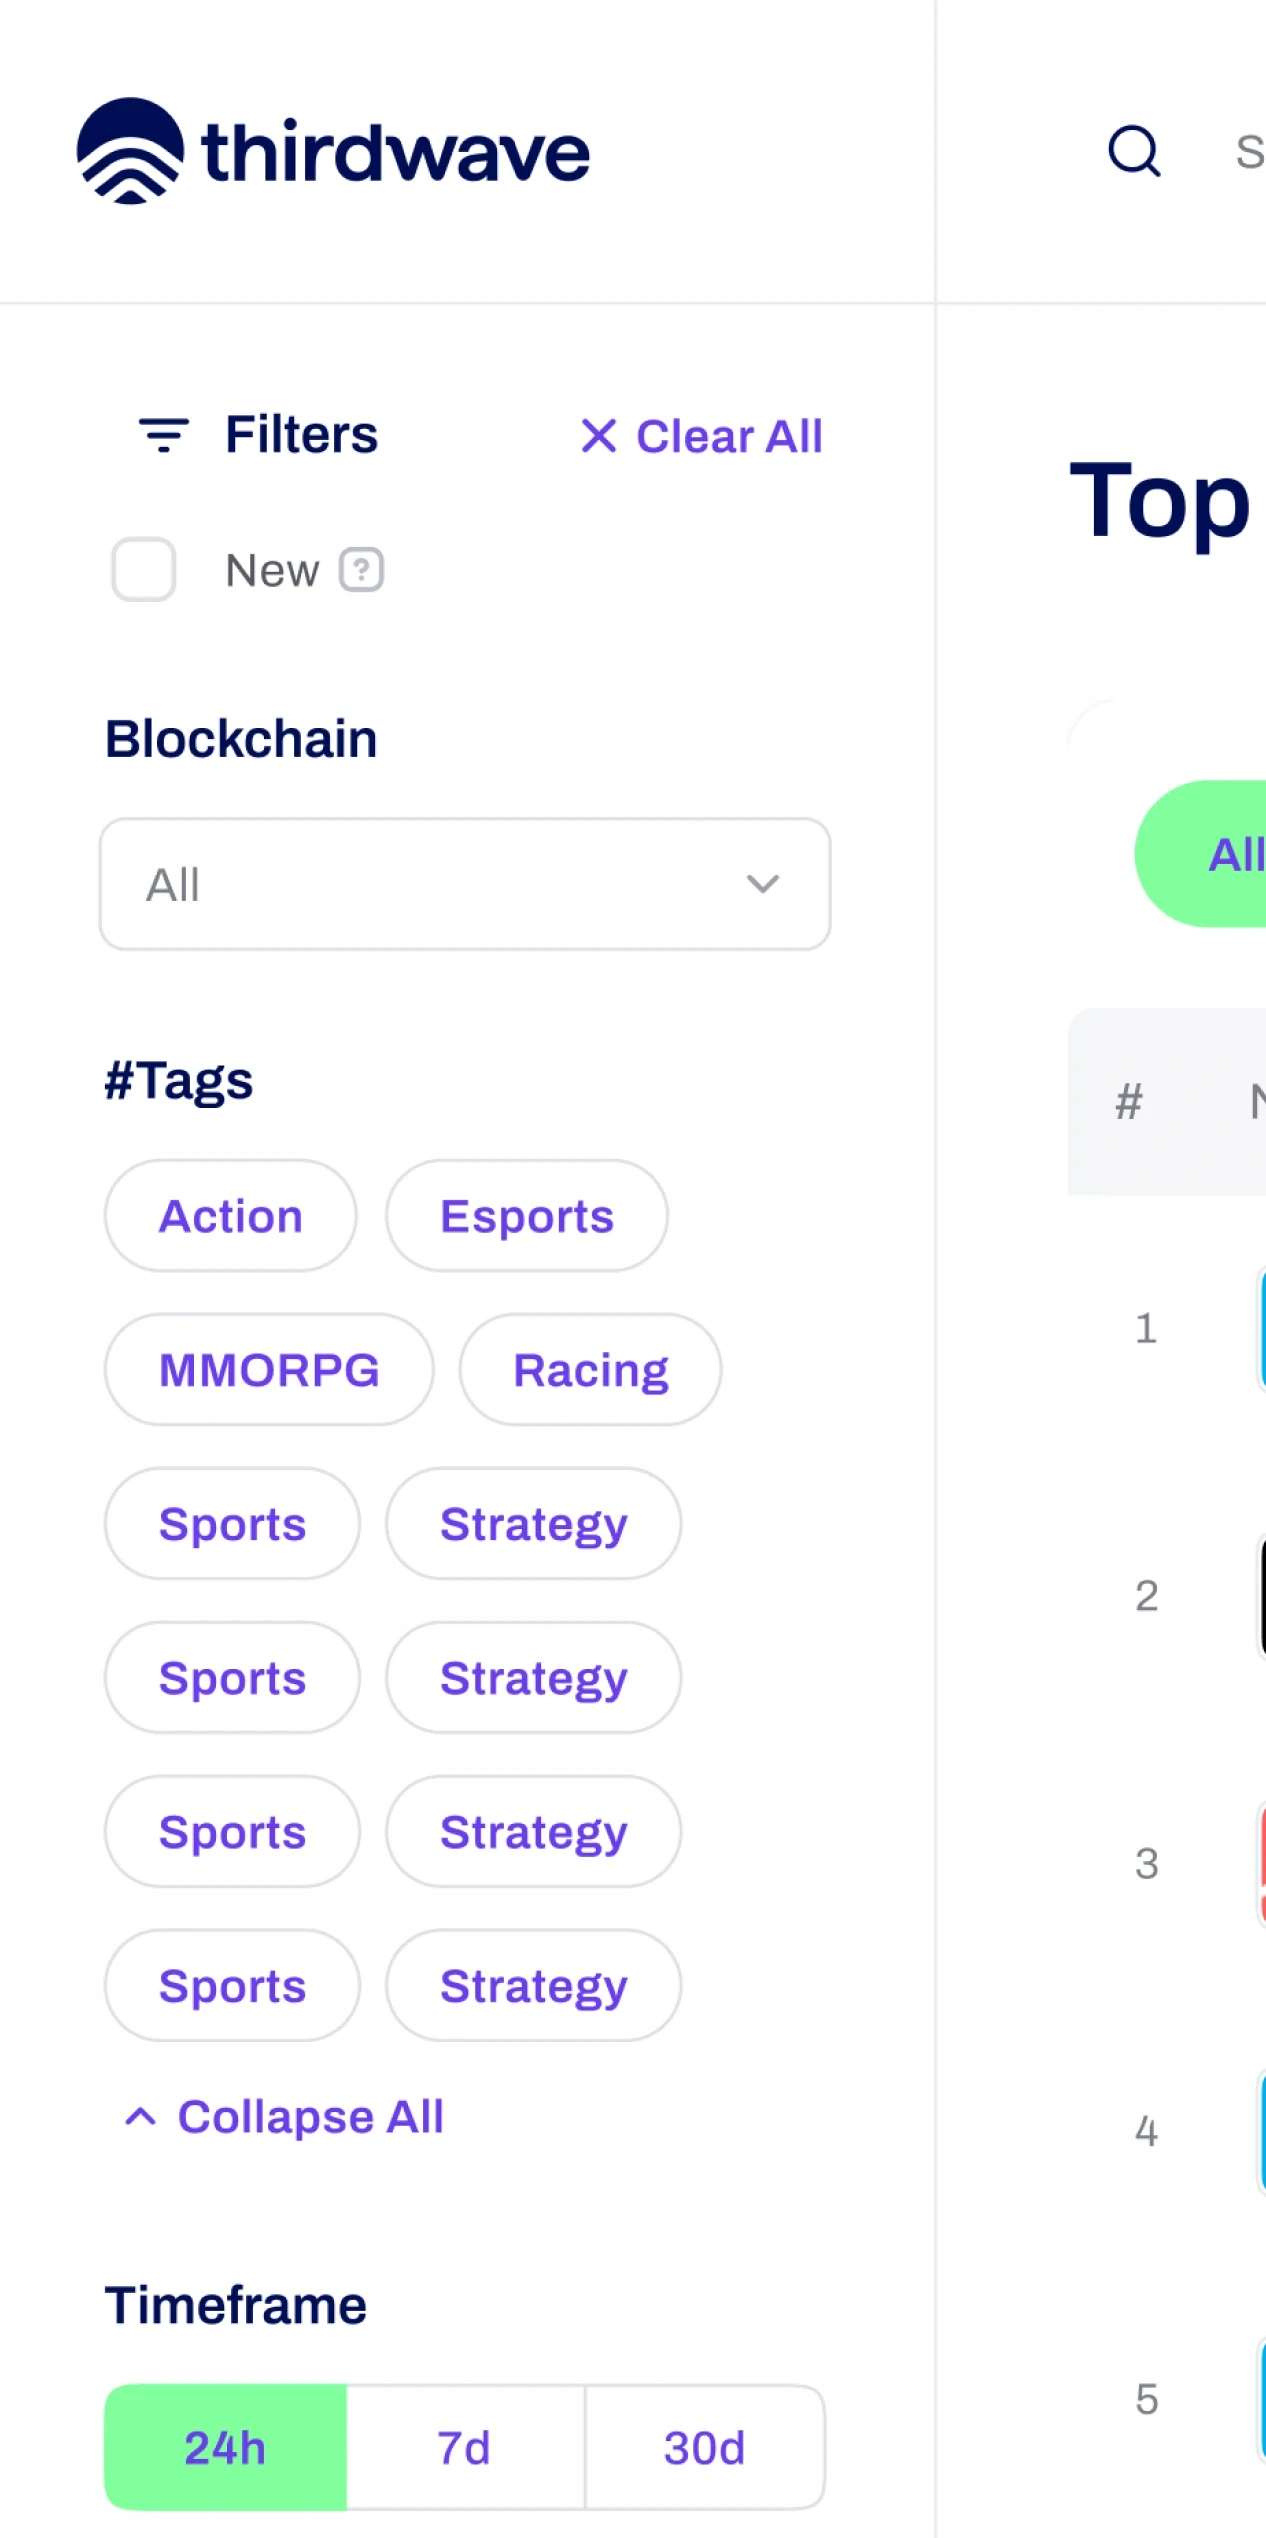
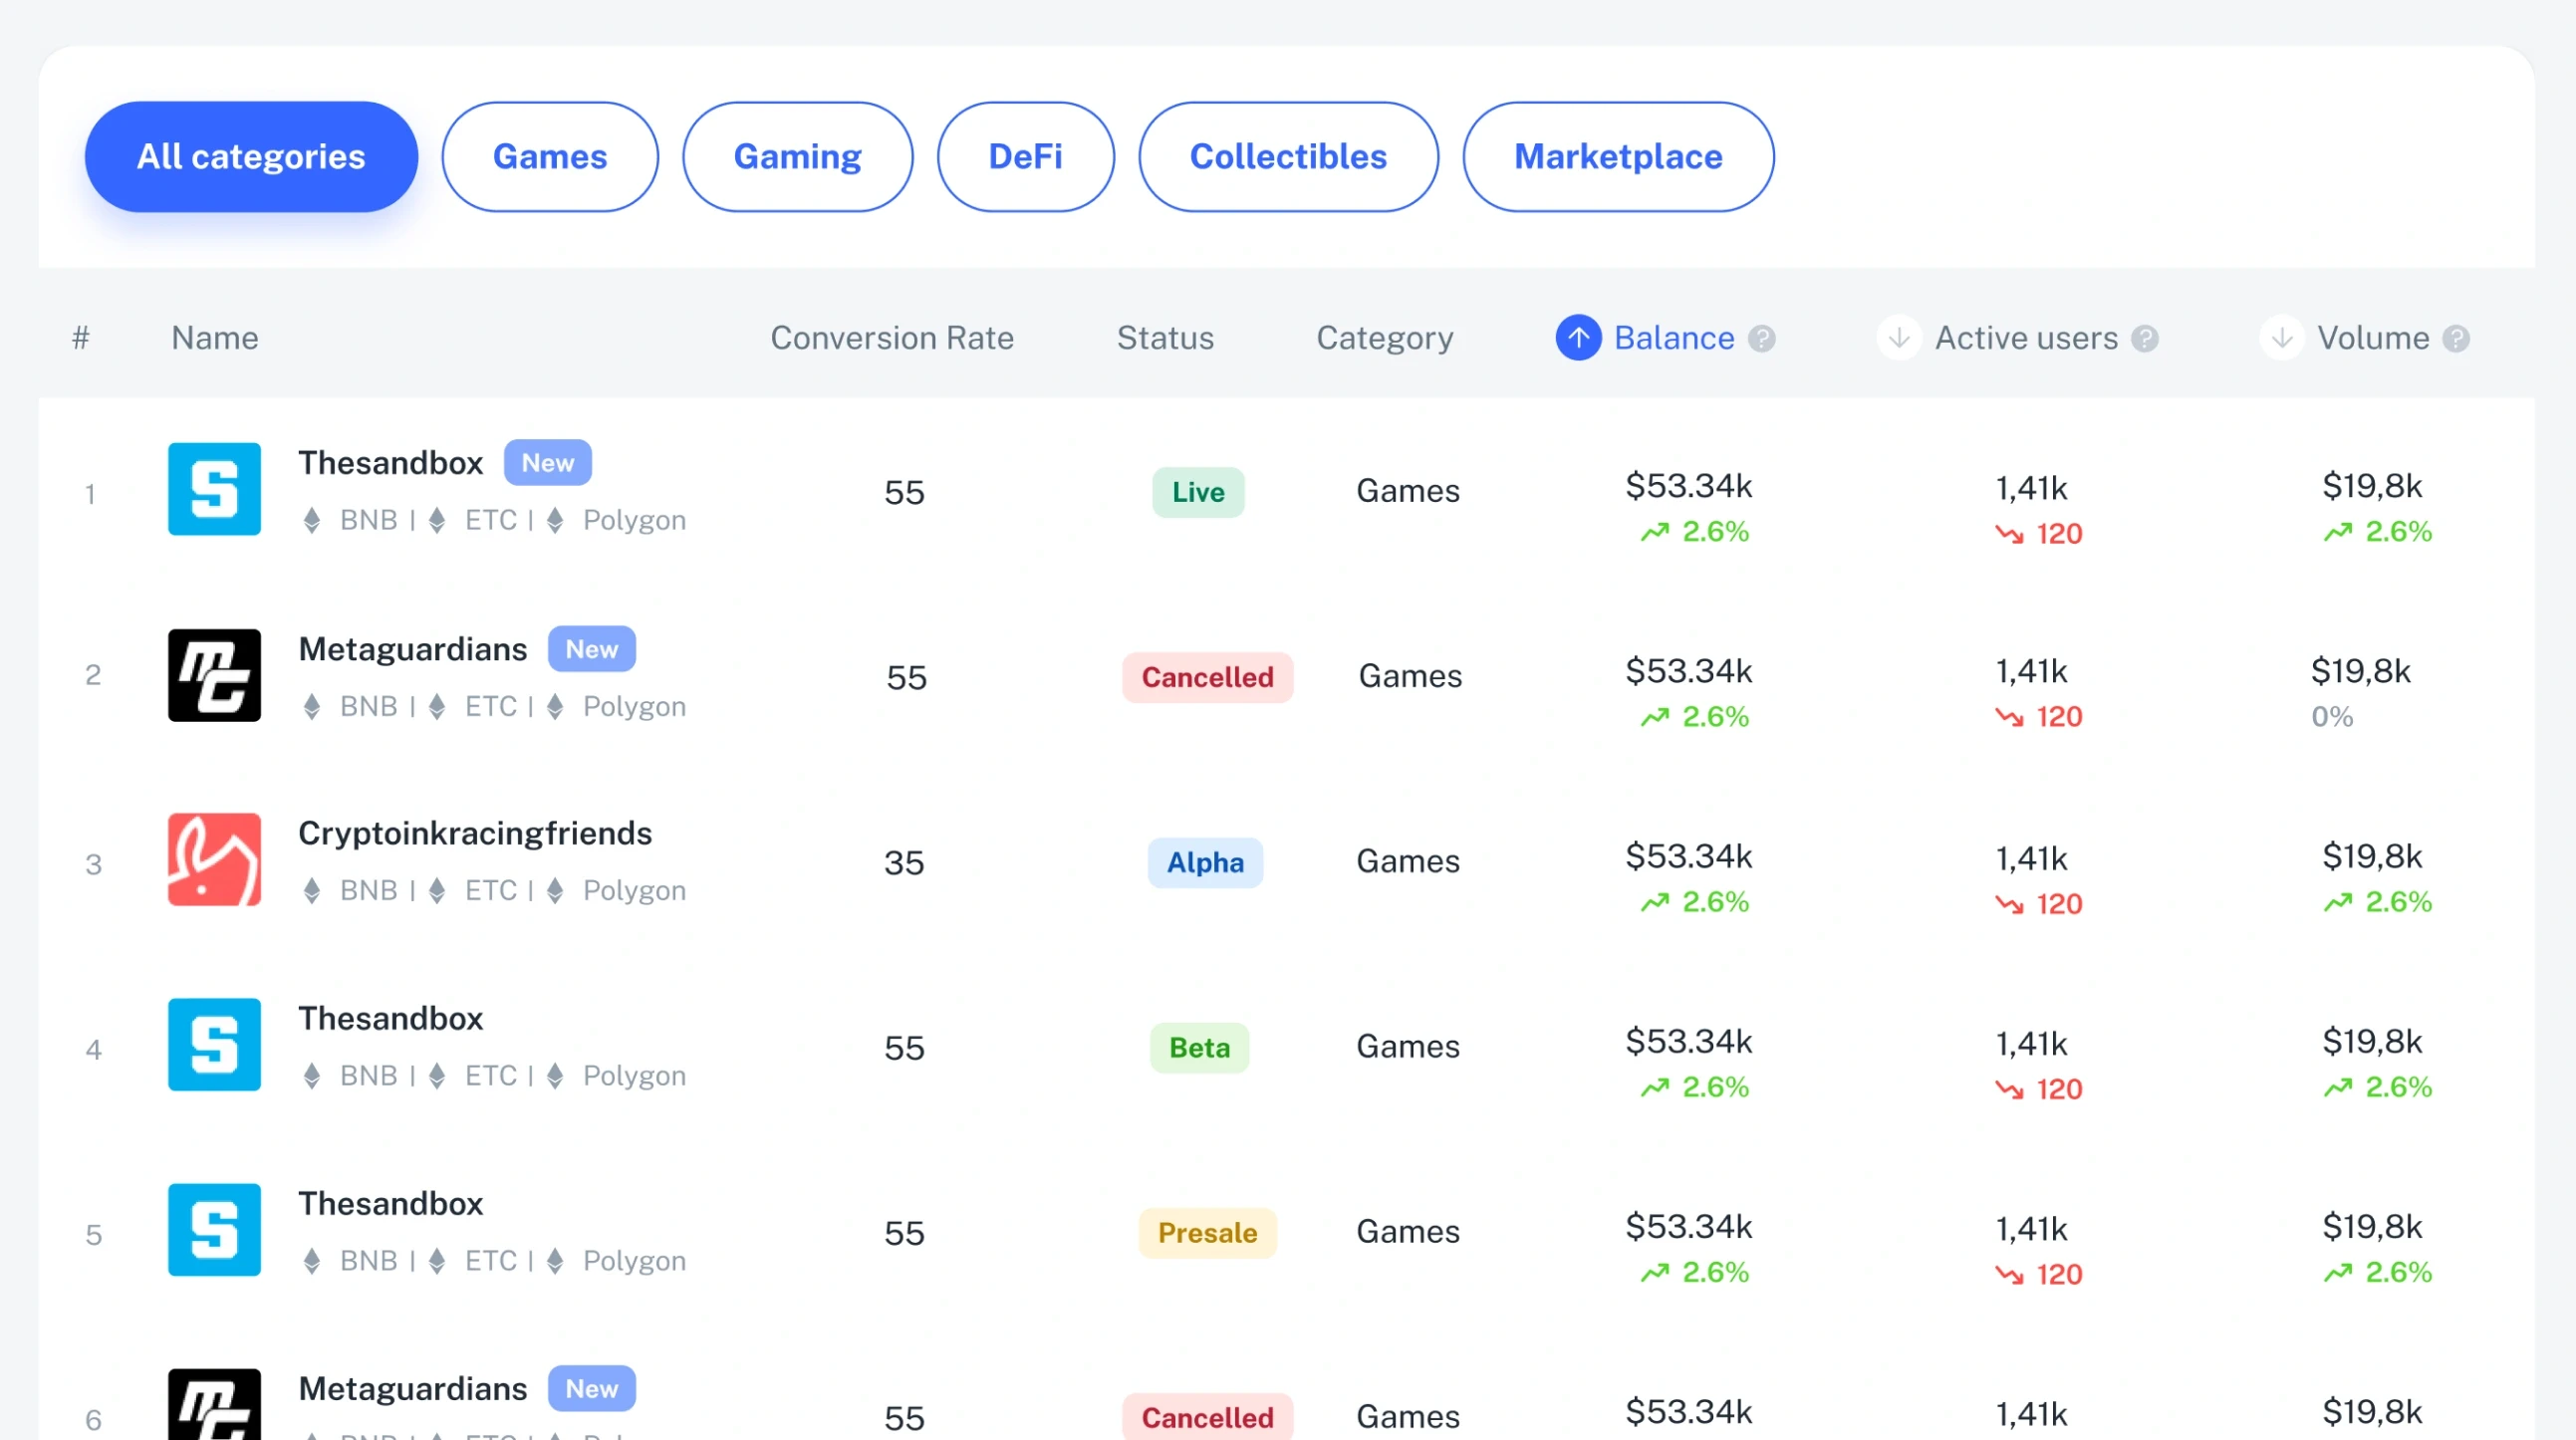
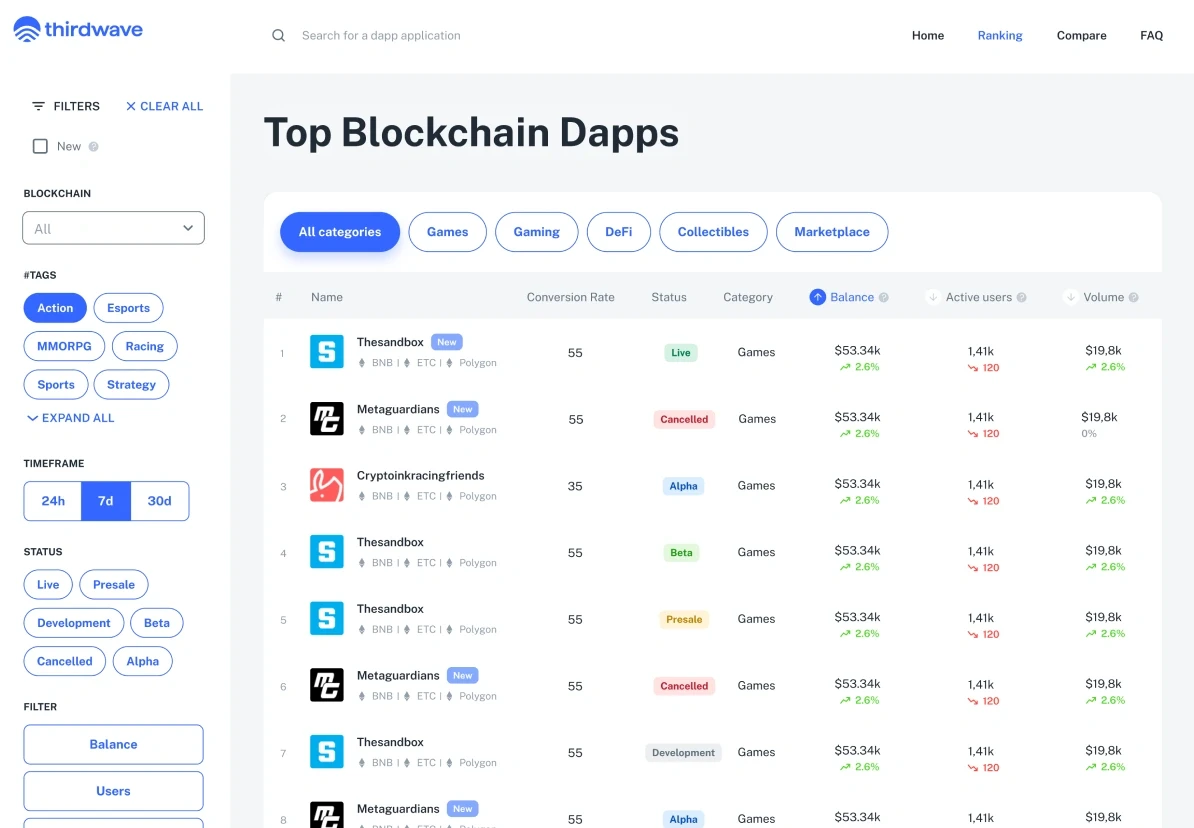
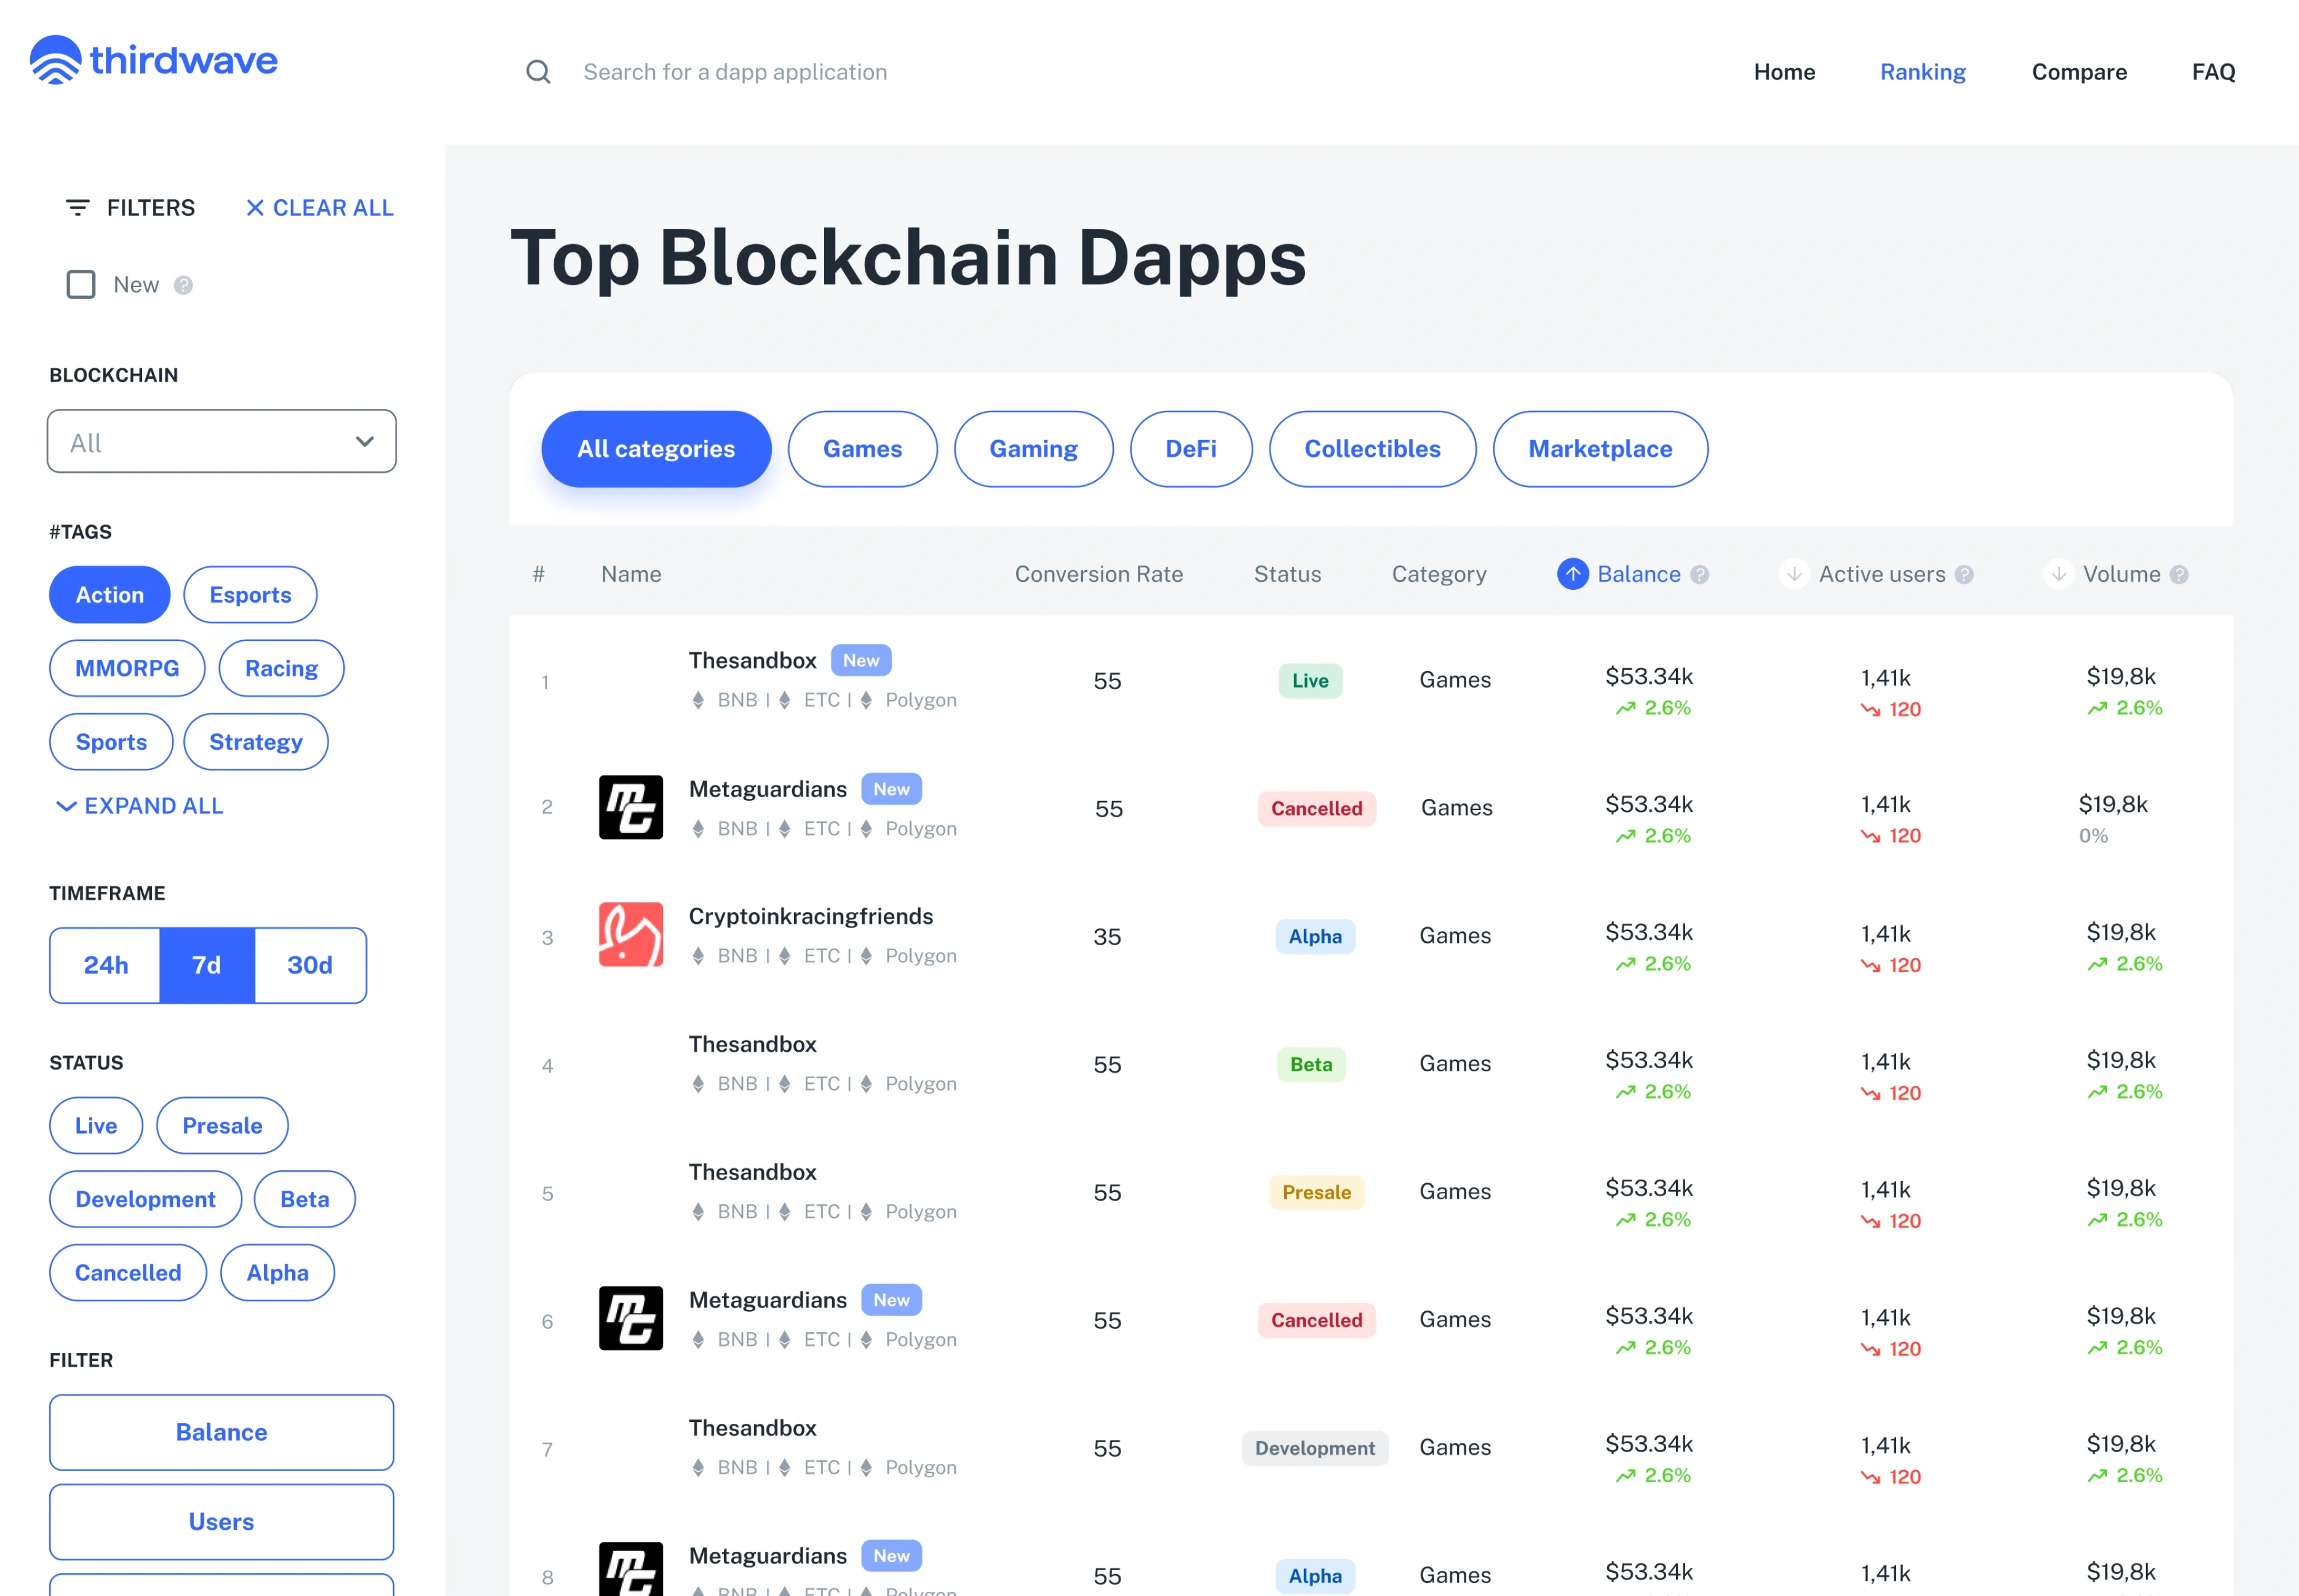
Top Blockchain Dapps: filters for blockchain, tags, timeframe and status on the left; the ranking table with each project’s chains, conversion rate, stage, category, balance, active users and volume.
RankingTop blockchain dapps: filters on the left, every project’s stage, balance, users and volume in one table.

Context

Thirdwave ranks blockchain games and apps by what actually happens around them: on-chain activity, the size and pulse of their communities, and their token markets. A studio, an investor or a player can see which projects are growing — and why — without opening a block explorer.

The work covers the ranking with its filters, the detail page of a single dapp across the chains it runs on, and the empty states in between.

Problem

Too many numbers, too few answers.

Every dapp can be measured a dozen ways — balance, active users, volume, conversion, followers, token holders — and every one of them changes by chain and by week. The product had to turn that into a list people can narrow down in seconds, and a page that explains one project without drowning its reader.

Constraints

Working within constraints

Sources
On-chain, social networks and market data, each with its own lag
Chains
One project on BNB, Polygon and Ethereum Classic at once
Stages
Live, presale, alpha, beta, in development — or cancelled
Time
24 hours, 7 days, 30 days
Genres
Action, esports, MMORPG, racing, sports, strategy and more
Gaps
New projects with no data yet

In the file

A ranking and the page behind every row

  • Ranking
  • Filters
  • Expanded tags
  • Dapp detail
  • Per-chain views
  • Social metrics
  • Token metrics
  • No-data state

Decisions

Decisions that shaped the product

Filters that stay beside the list.

Why
The question is always narrower than the list: this chain, this genre, this week.
Result
Blockchain, tags, timeframe and status live in a side panel next to the table; tags fold behind ‘Expand all’, and one click clears everything.
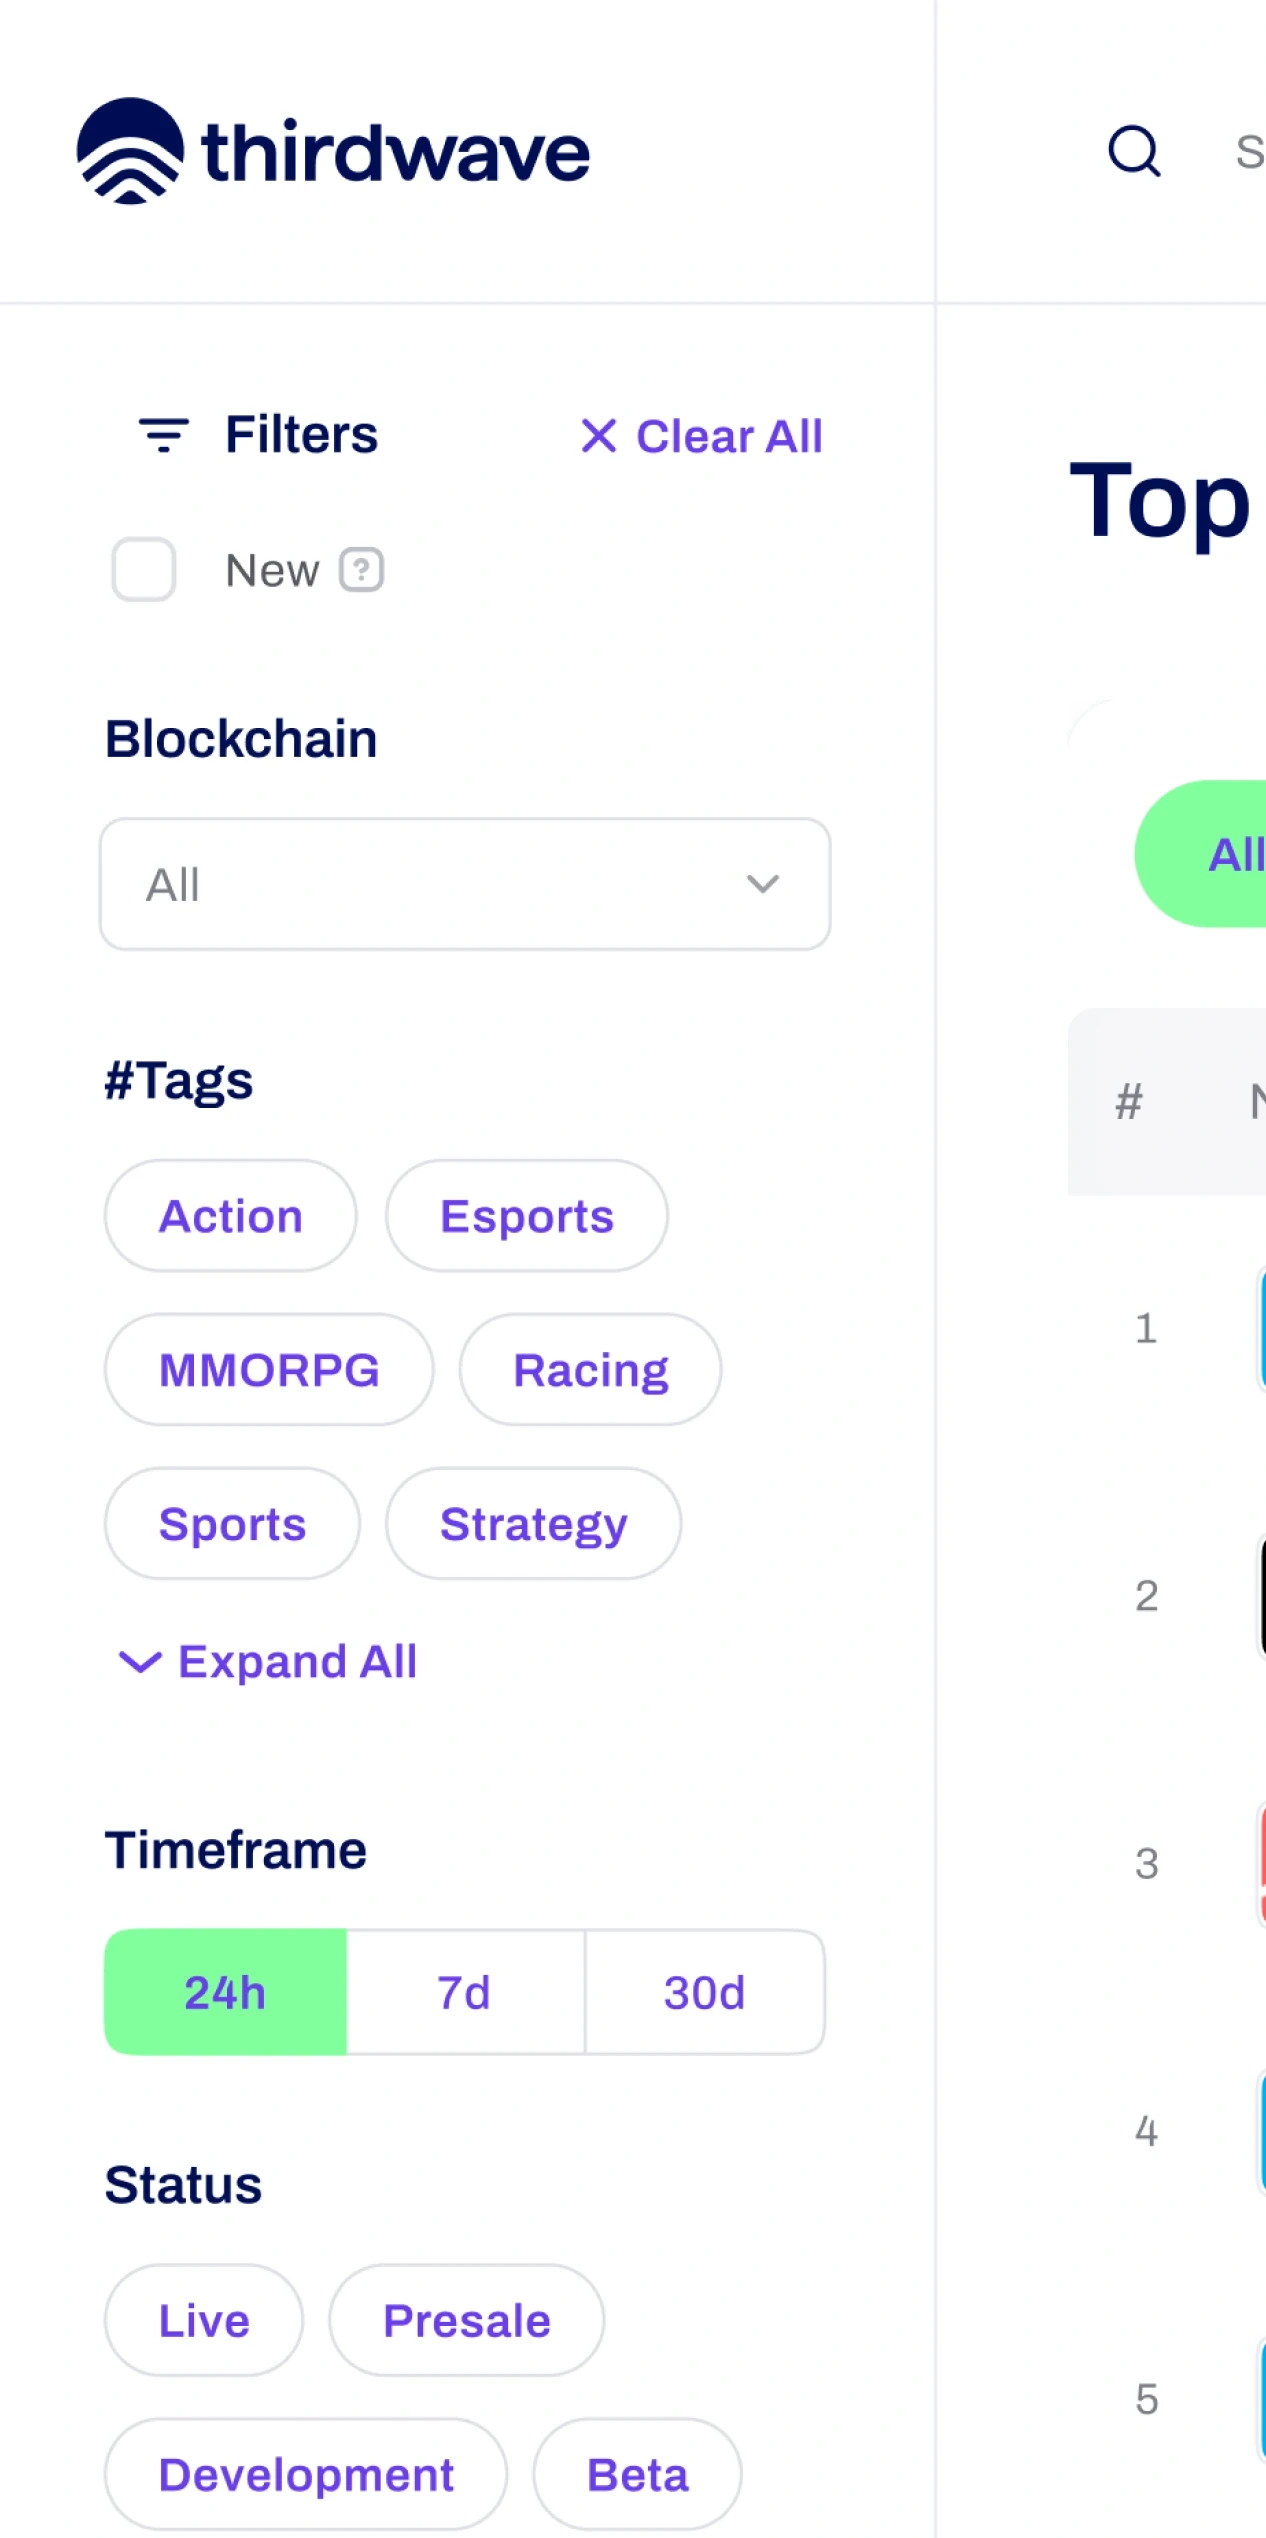
The filter panel beside the table: New, Blockchain, six tags with Expand all, Timeframe 24h / 7d / 30d and Status, with Clear all at the top.
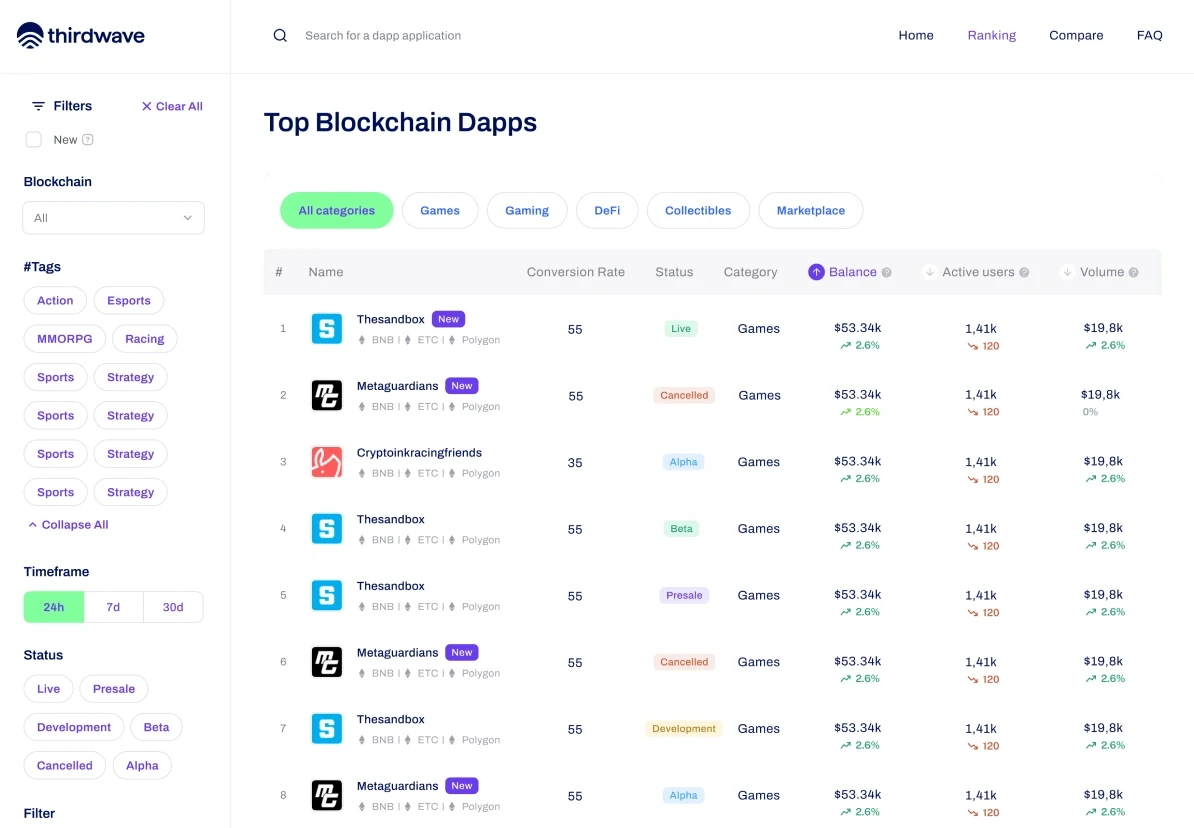
The same panel with the tags unfolded and a Collapse all link under them.

The stage of a project, said in a word.

Why
A cancelled project and a live one look the same in a table of numbers.
Result
Every row carries its stage — live, presale, alpha, beta, development, cancelled — as a coloured tag between conversion and category.
The ranking table with a coloured stage tag in every row — Live, Cancelled, Alpha, Beta, Presale — between the conversion rate and the category.

Every number says where it comes from.

Why
On-chain and social figures are easy to over-trust.
Result
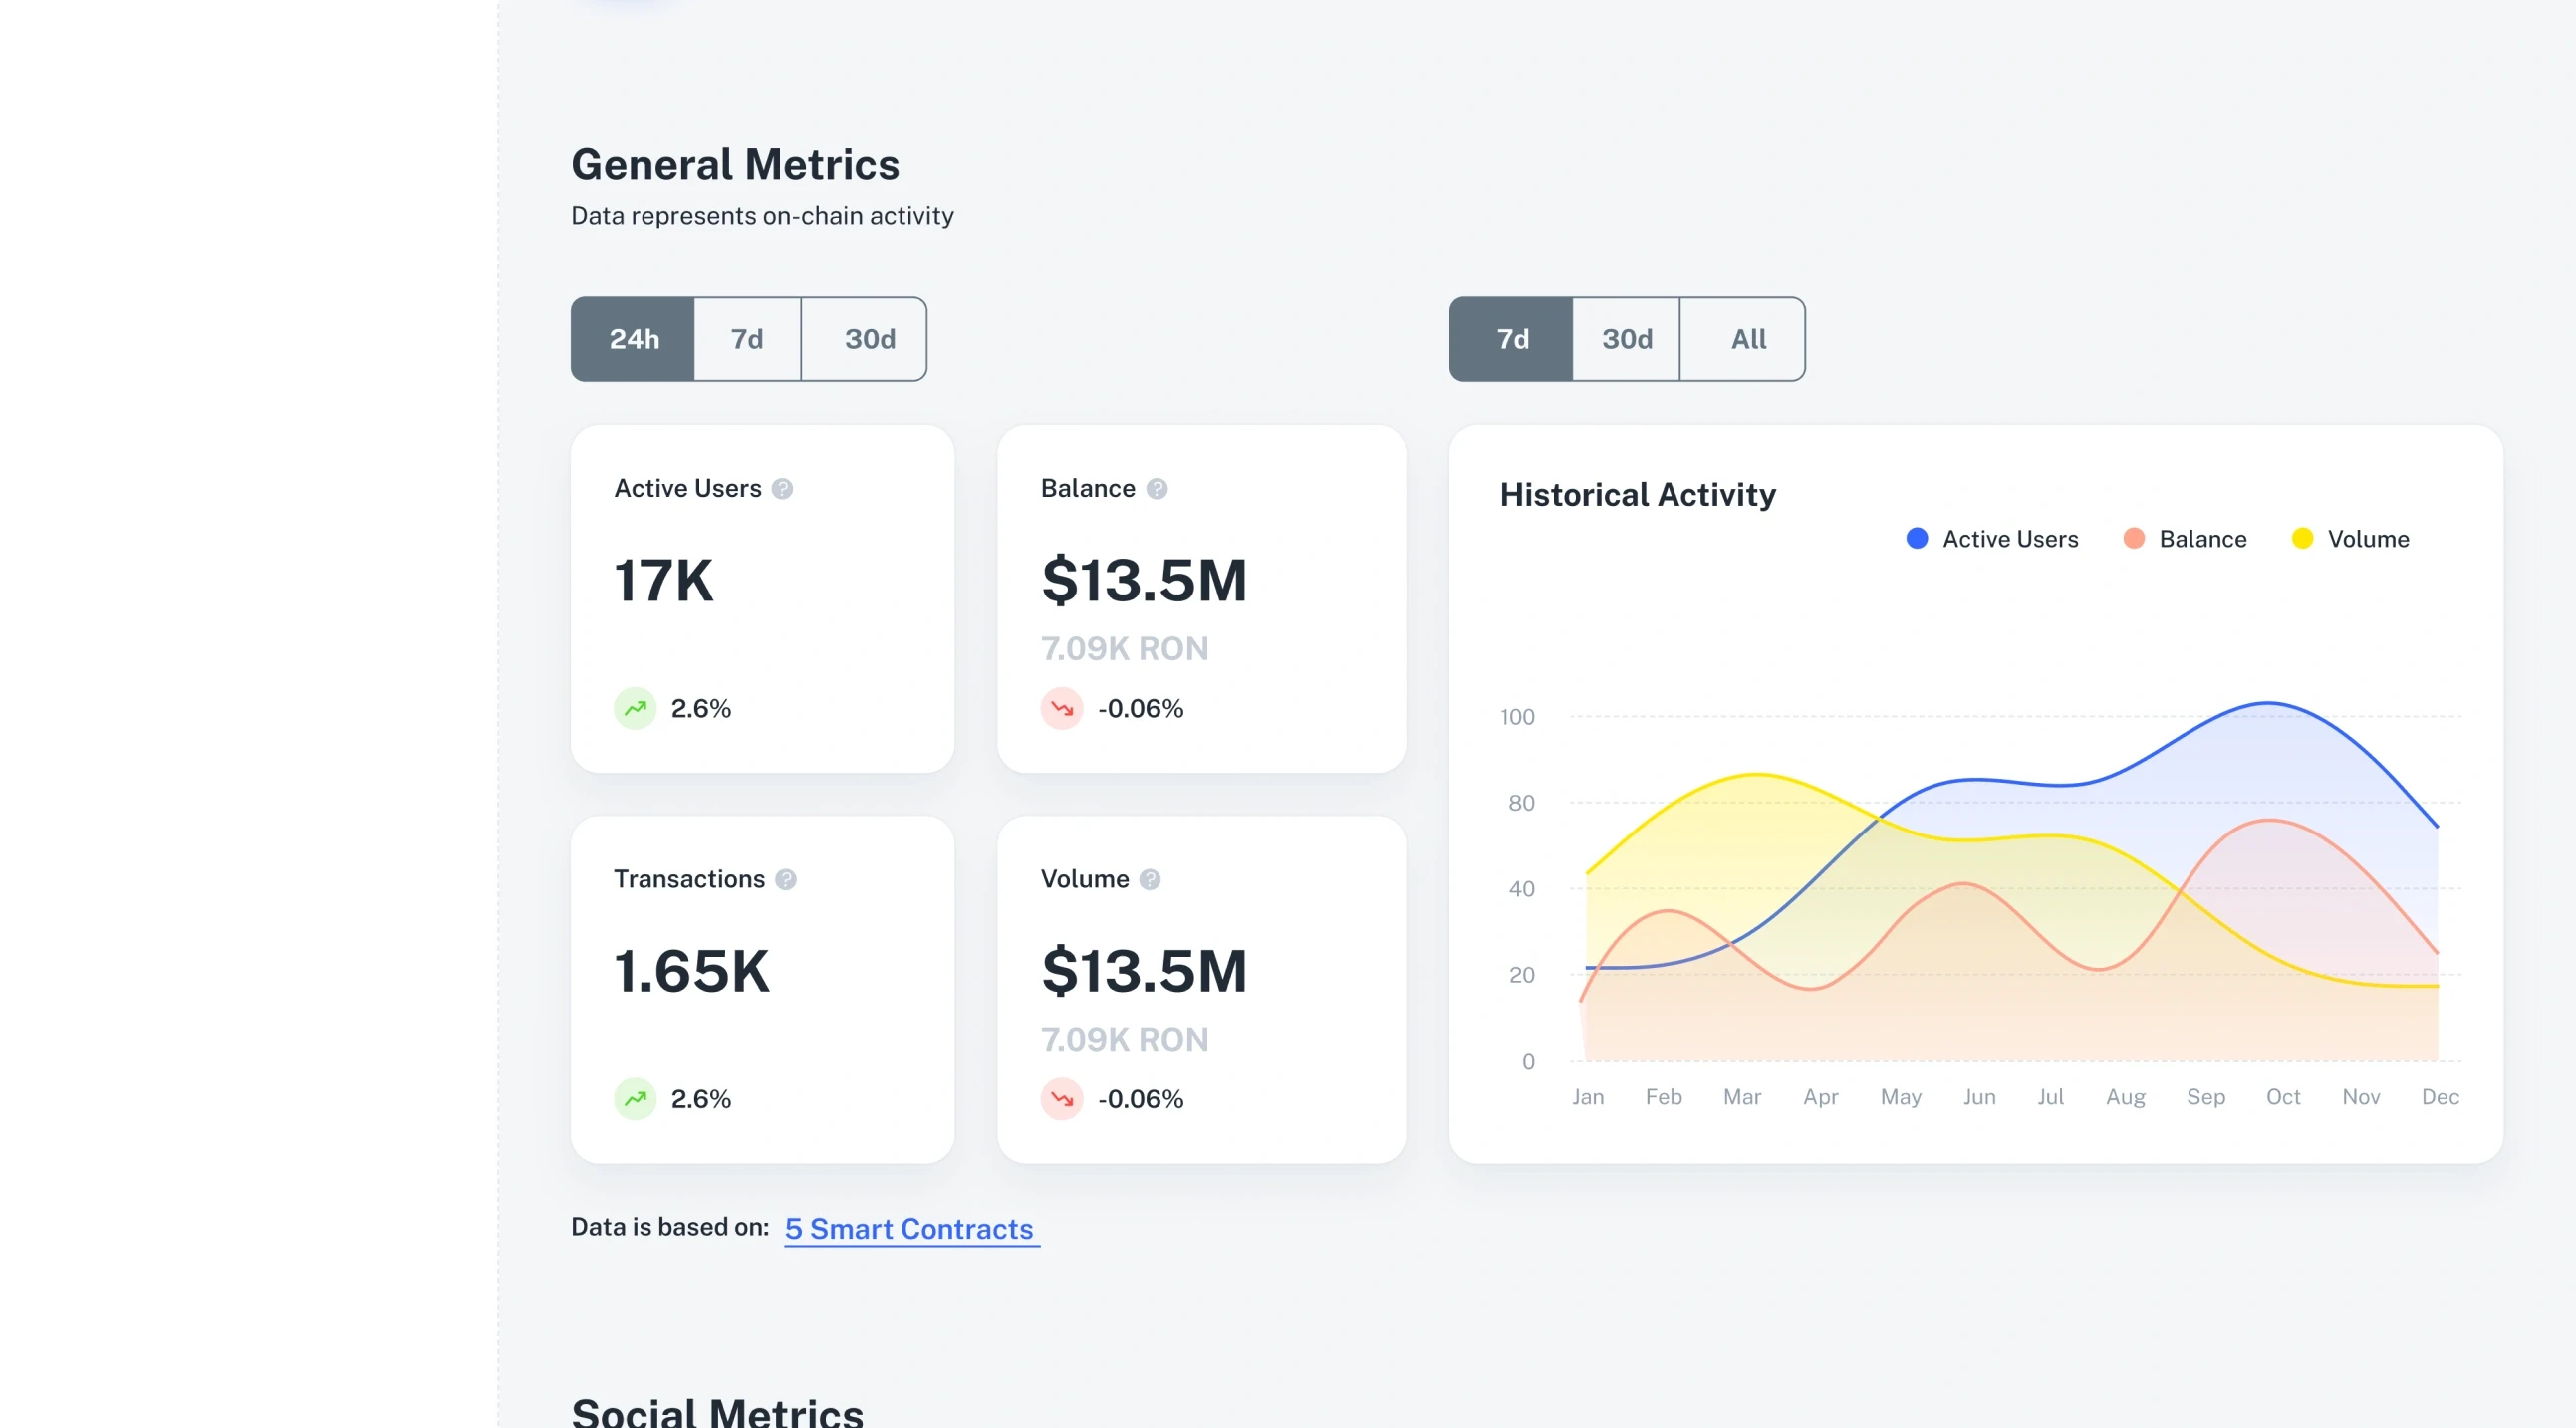
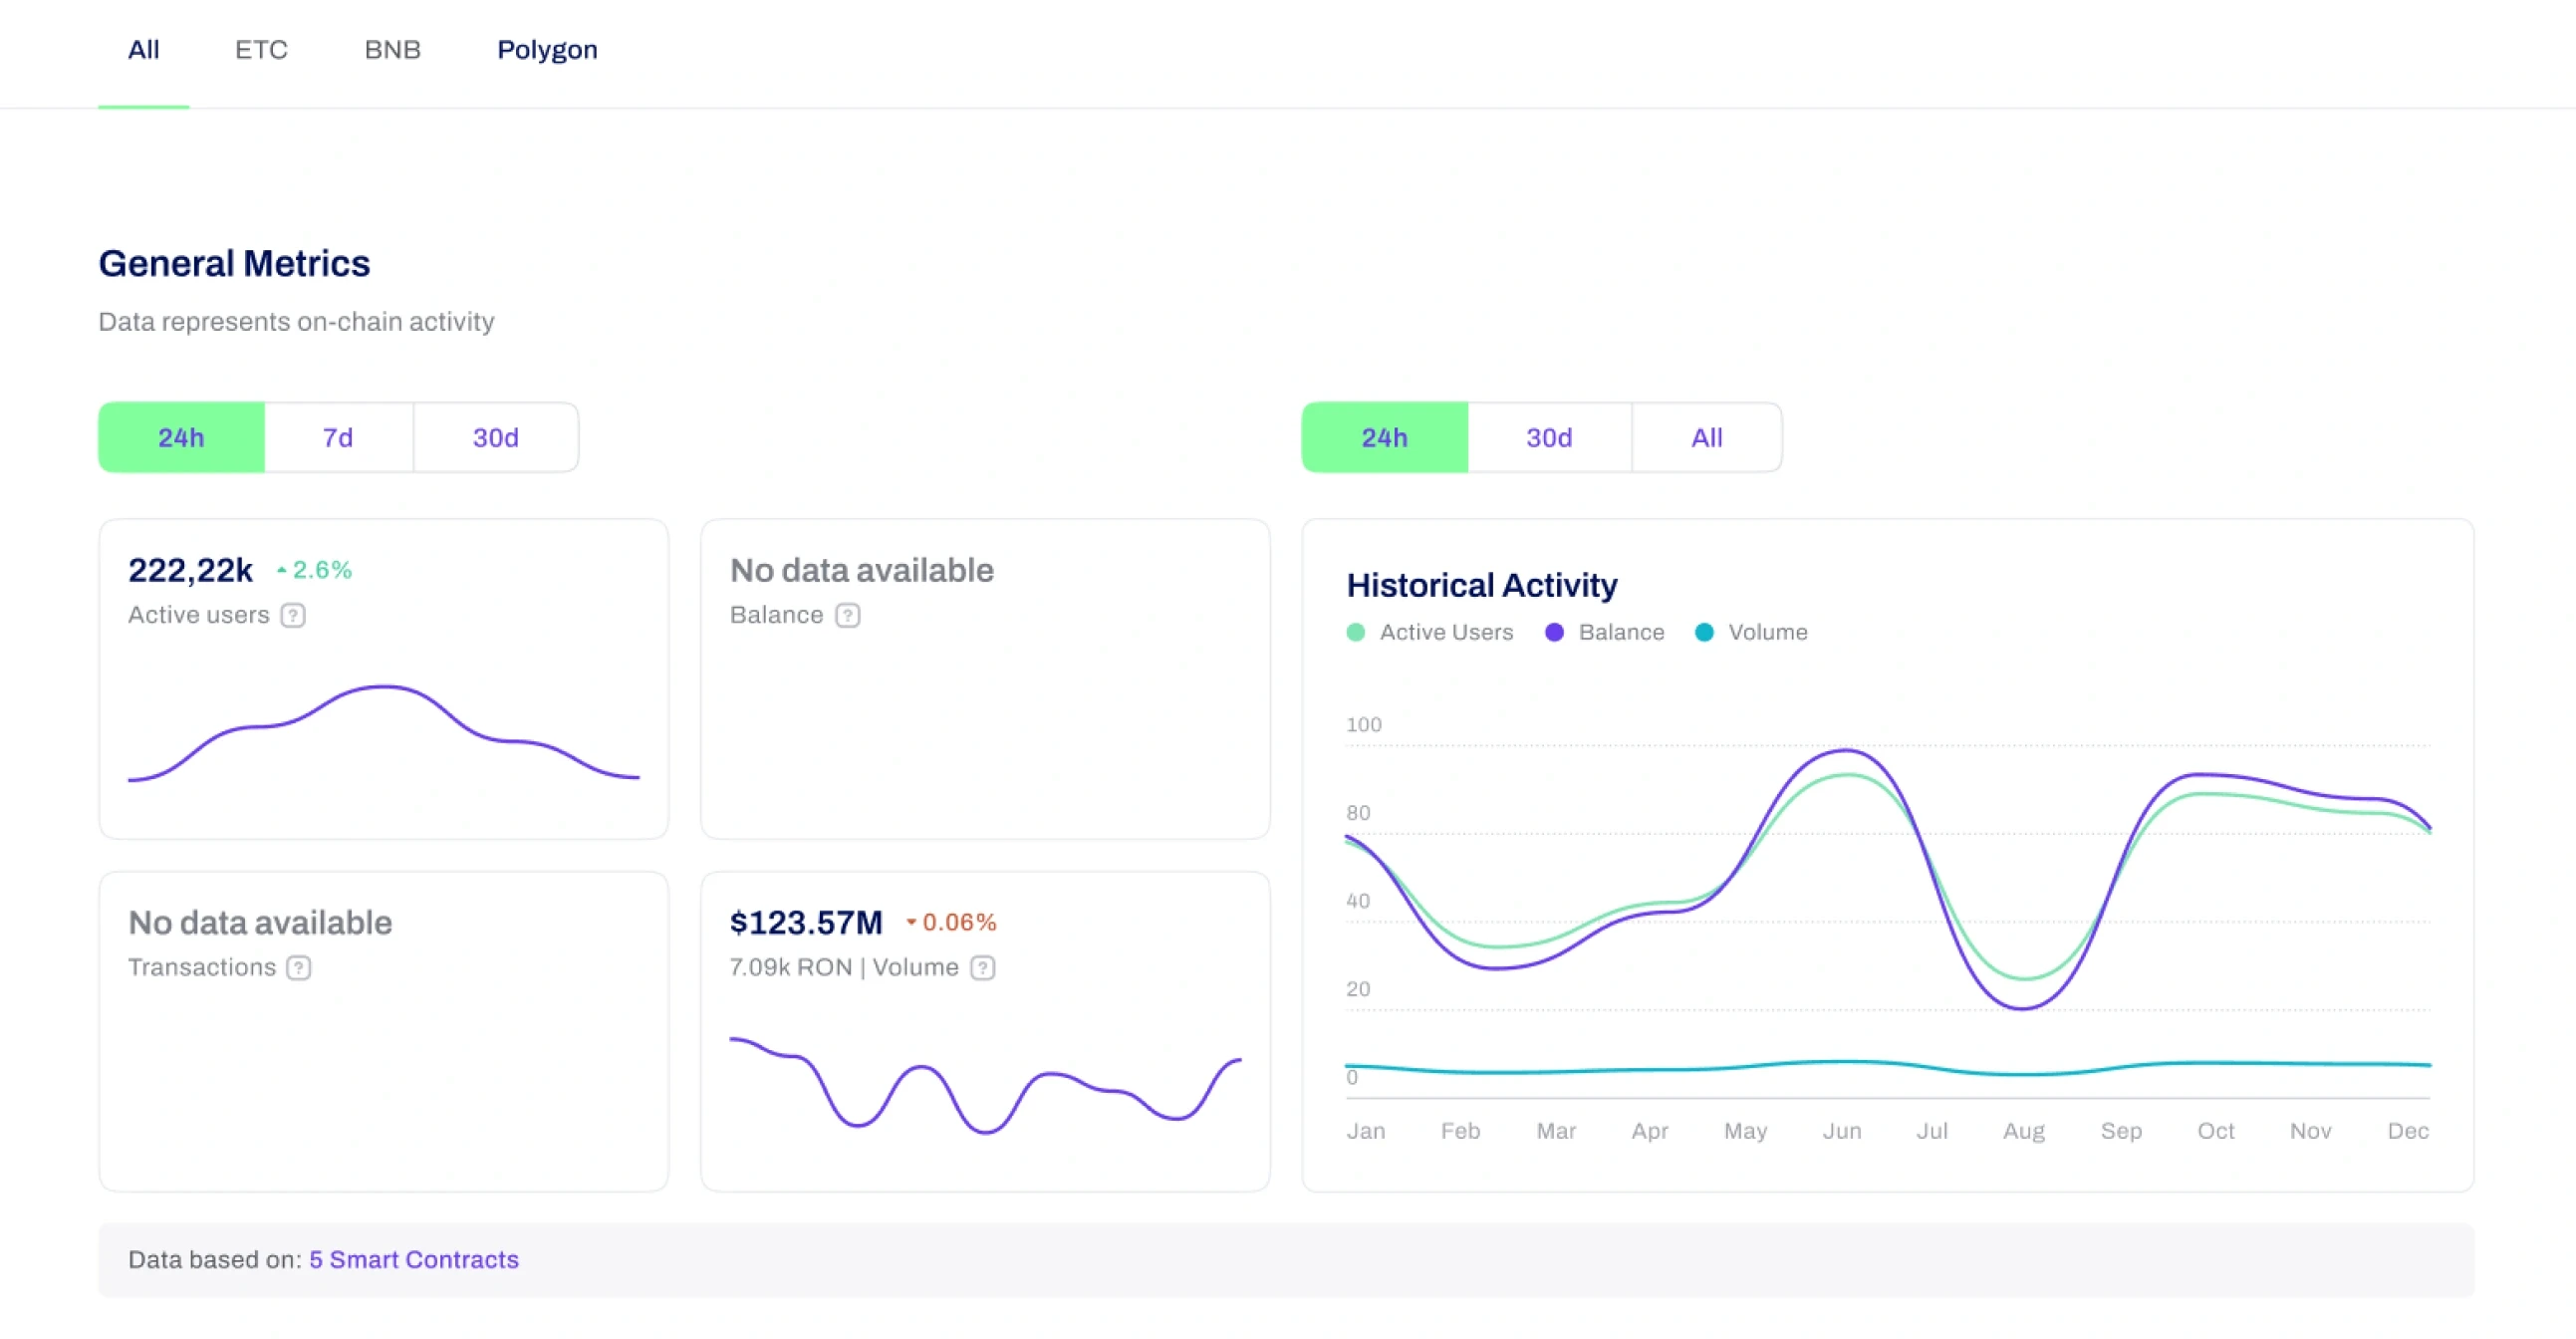
Each block names its source under the title — on-chain activity, social networks, market data — and how many smart contracts it is based on.
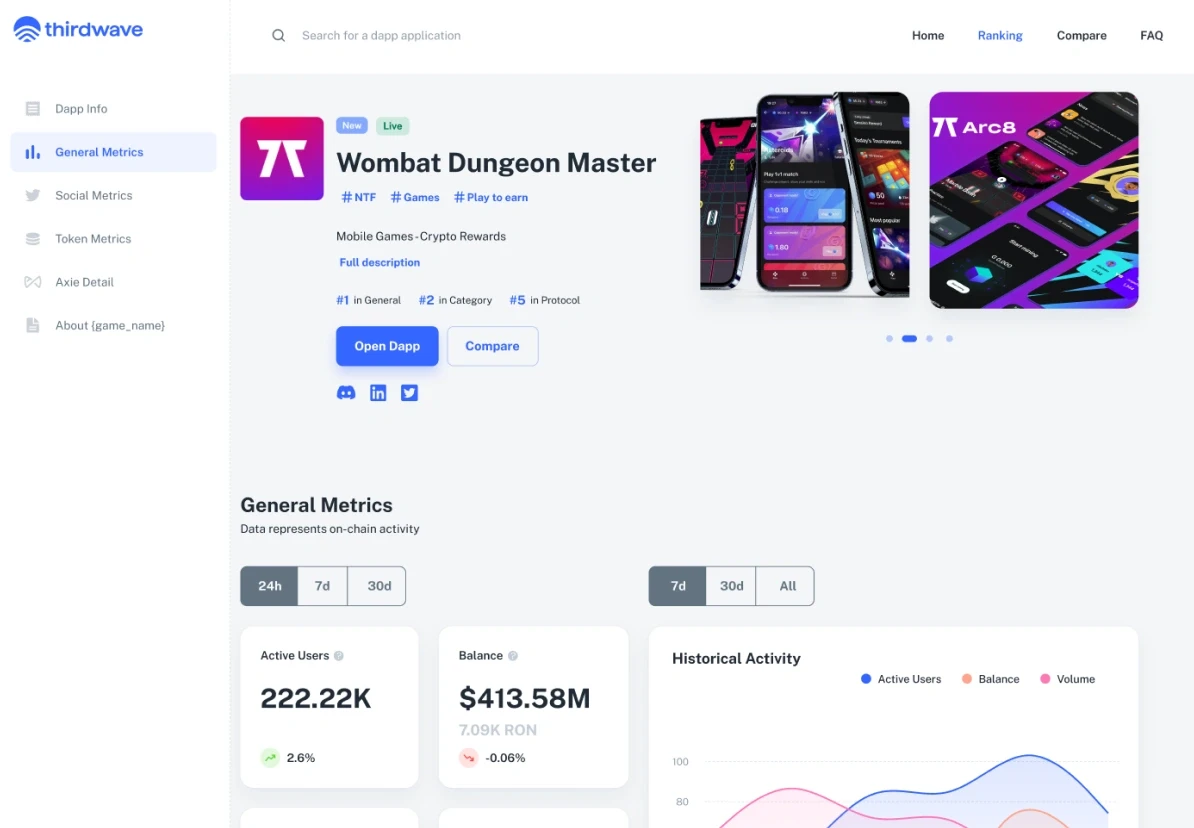
General Metrics — “Data represents on-chain activity”: active users, balance, transactions and volume with their changes, a historical activity chart, and “Data is based on 5 smart contracts” underneath.

One project, every chain it runs on.

Why
The same game lives on BNB, Polygon and Ethereum Classic, with different numbers on each.
Result
Chain tabs at the top of the detail page switch every metric below without leaving the page.
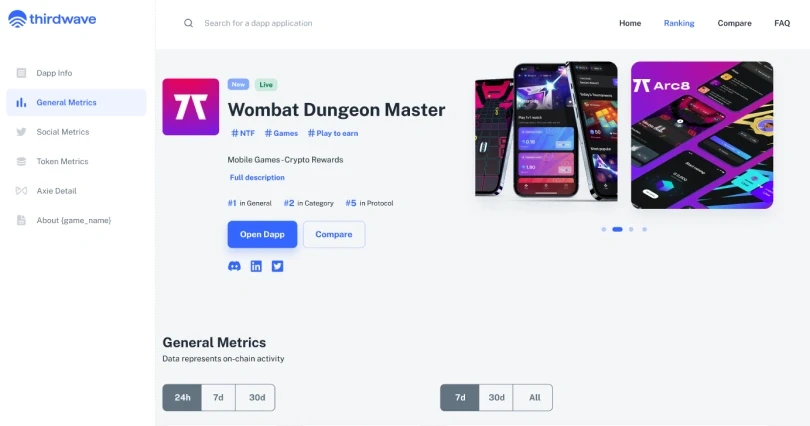
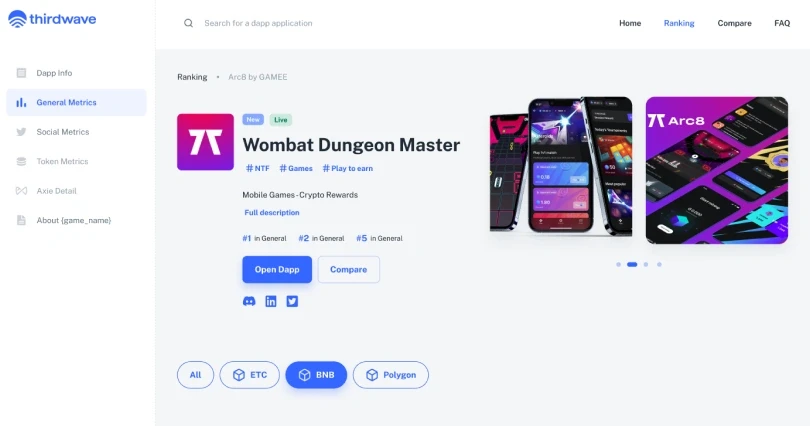
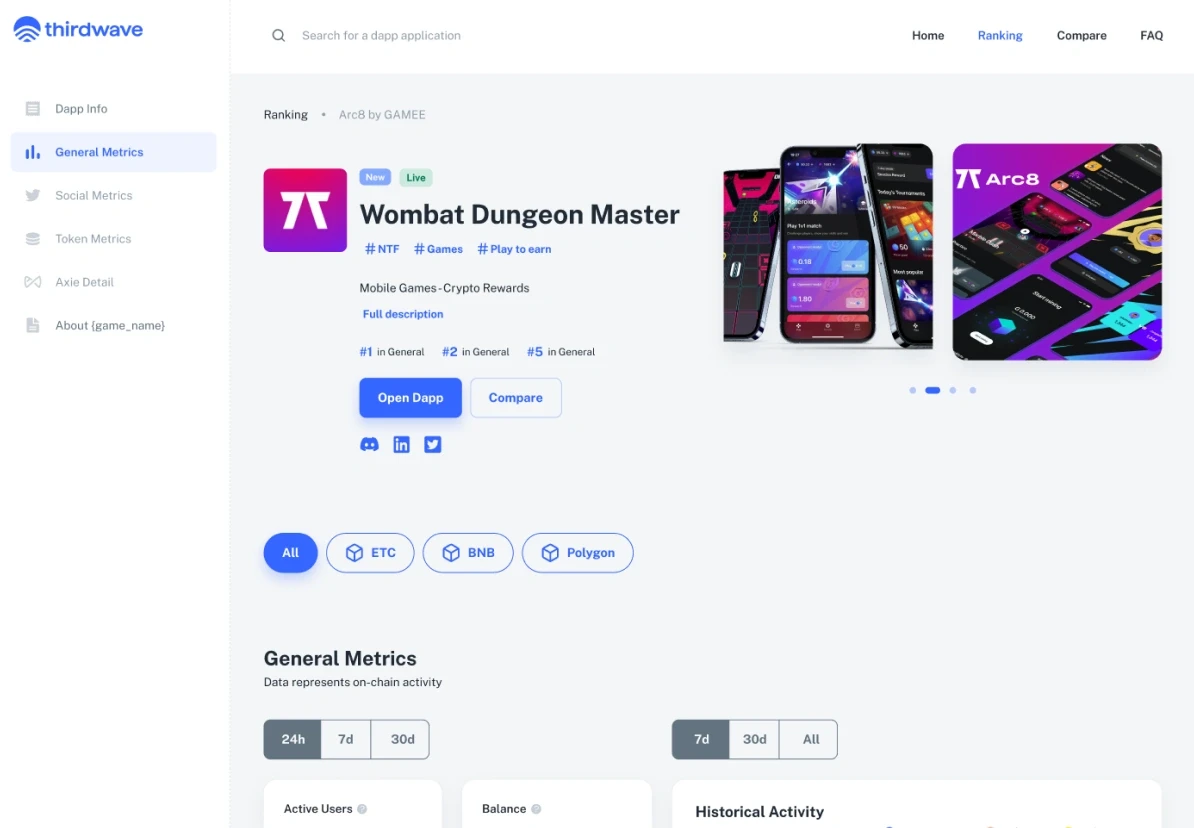
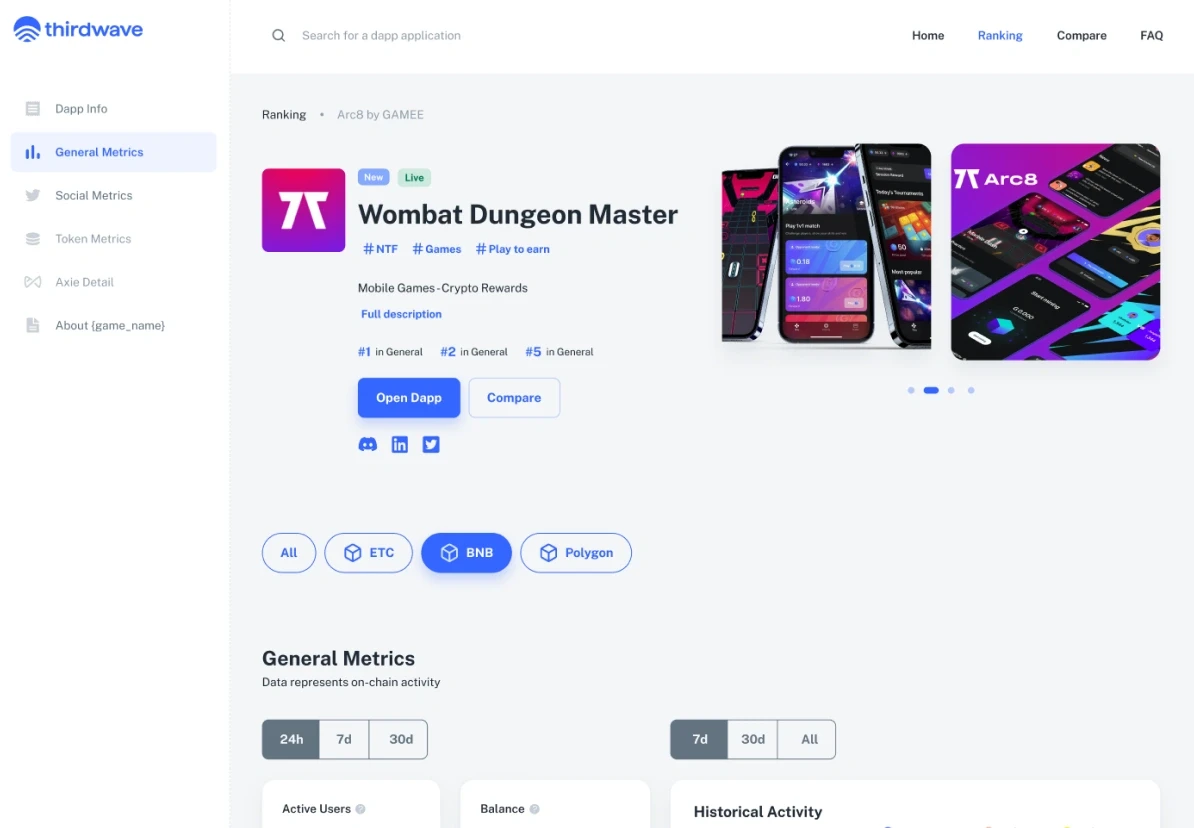
The detail page of Wombat Dungeon Master above its General Metrics.
The same page with the chain tabs — All, ETC, BNB, Polygon — and BNB picked.
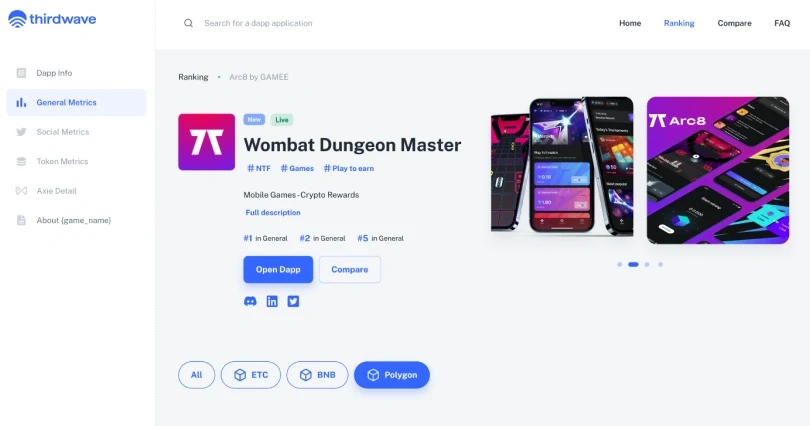
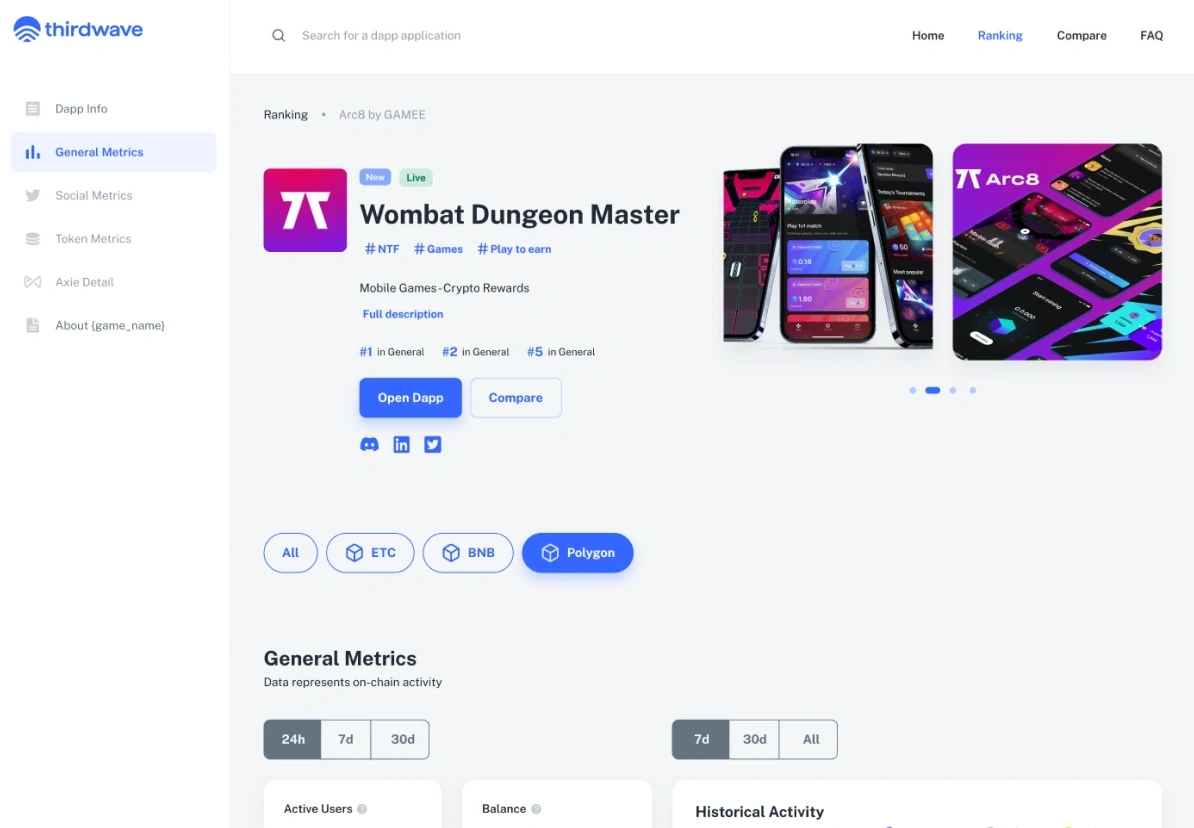
The same page with Polygon picked.

An honest empty state.

Why
New projects often have nothing to measure yet.
Result
The no-data variant keeps the layout and says so, instead of filling the page with zeros.
General Metrics for a new project: the same cards and charts, with “No data available” where a figure would be.

System

Quiet tables, loud signals

Grey and white carry the data; one blue marks what is selected, and green and red appear only where something went up or down.

Mark

The Thirdwave logo — a blue wave above the wordmark — on white.

The wordmark as it sits in the app bar, at actual size.

Typeface

  • Public Sans — the product
  • Bold for headings and figures
  • Regular for tables and labels

Palette · sampled from the screens

  • #212B36
  • #FFFFFF
  • #3366FF
  • #54D62C
  • #637381
  • #FF4842

Solid fills, sampled by frequency from the ranking and the detail page.

Screens

From the list to one project

  • Top Blockchain Dapps: the filter panel and the ranking table.

    Ranking

    Every dapp, filtered and ranked.

  • The ranking with every tag unfolded in the filter panel.

    Tags

    All genres, unfolded.

  • The detail page of Wombat Dungeon Master: its stage and tags, its rank, Open Dapp and Compare, and screenshots of the game.

    Detail

    One project, all its numbers.

  • The detail page scrolled to General Metrics: active users, balance and the historical activity chart.

    General Metrics

    Active users, balance and their history — on-chain.

  • The detail page with the BNB tab picked above General Metrics.

    BNB

    The same numbers with BNB picked…

  • The detail page with the Polygon tab picked above General Metrics.

    Polygon

    …and with Polygon.

Craft

The details that carry it

Two places where the design does quiet work.

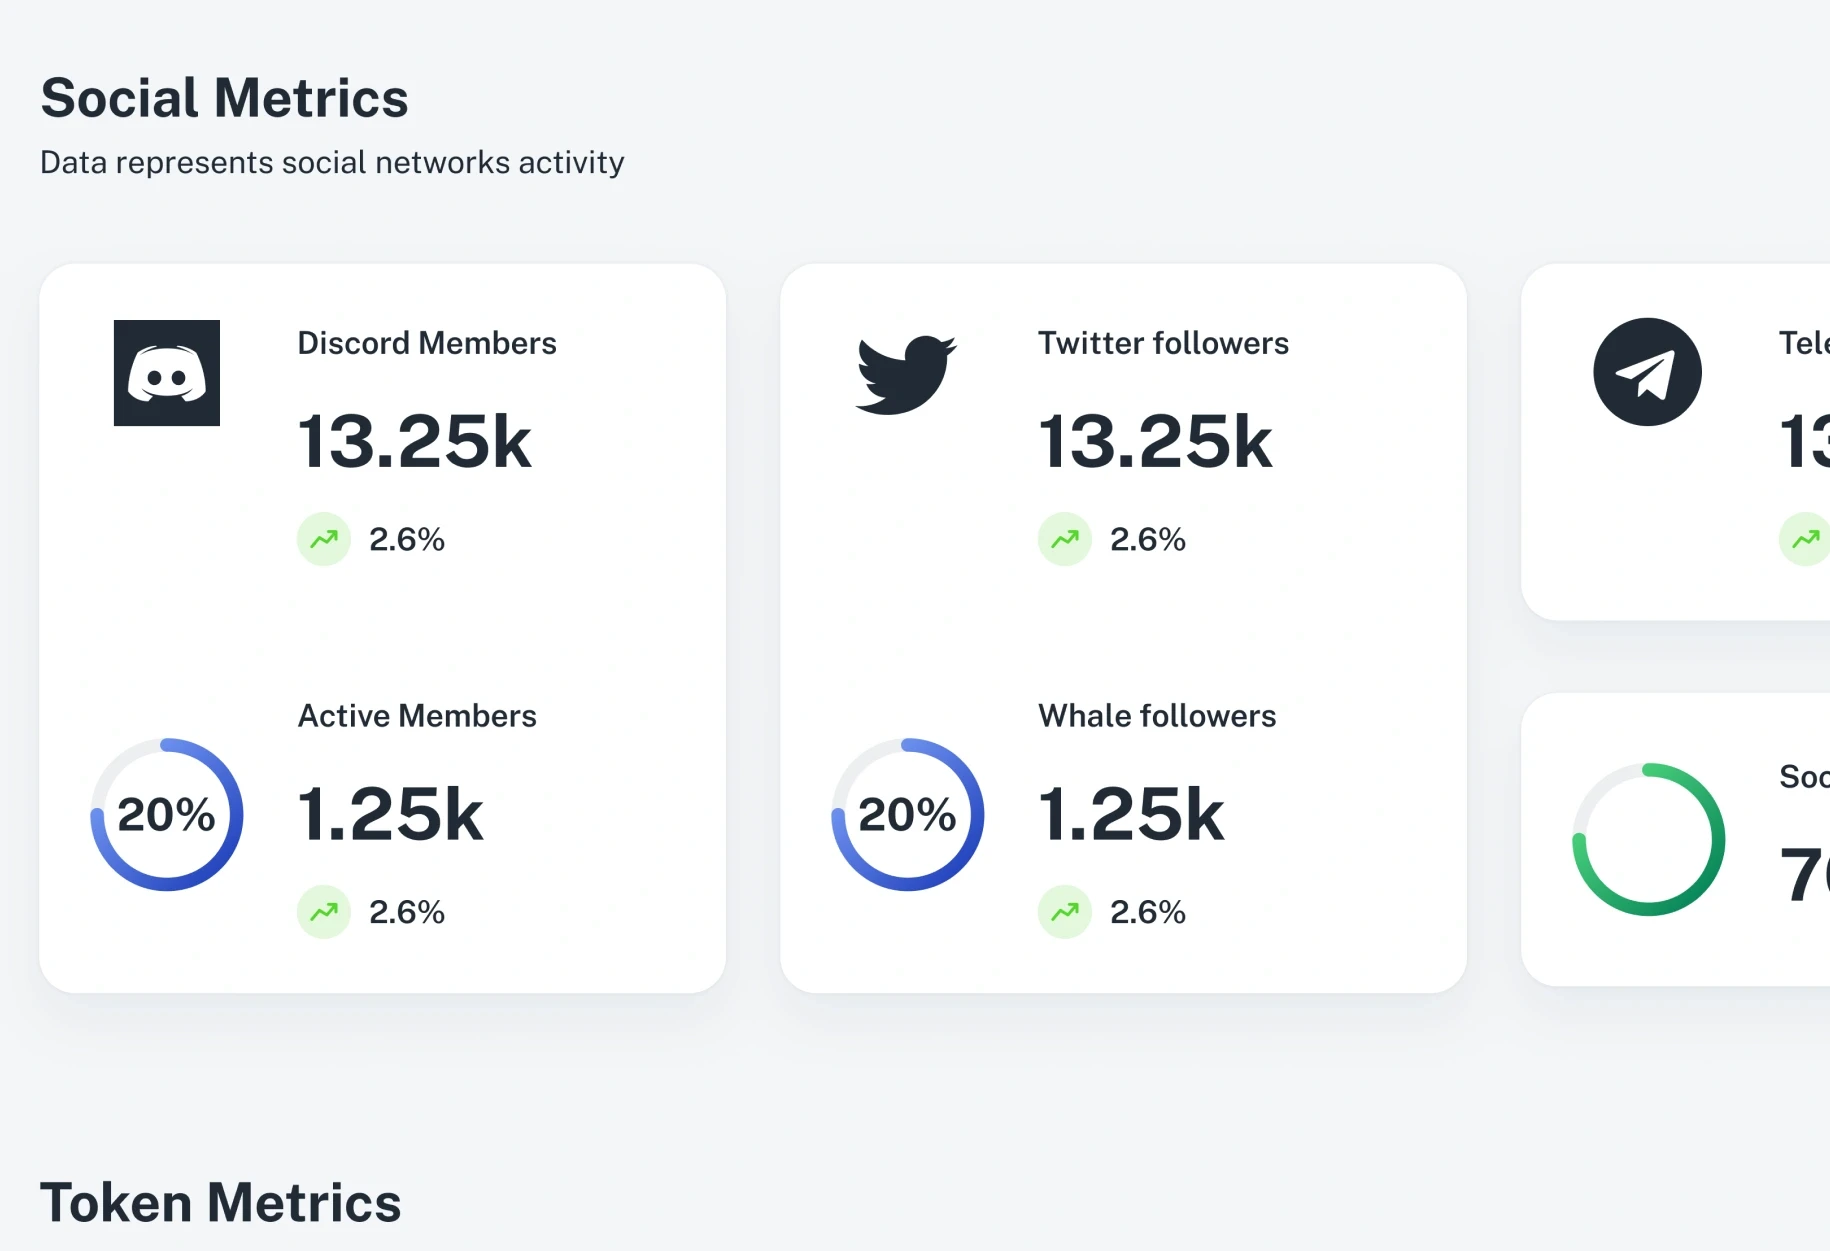
Social Metrics: Discord members, Twitter and Telegram followers, each with its change, and active members and whale followers with a 20% conversion ring.
Social metricsFollowers, active members and a conversion ring — the community measured the same way as the chain.
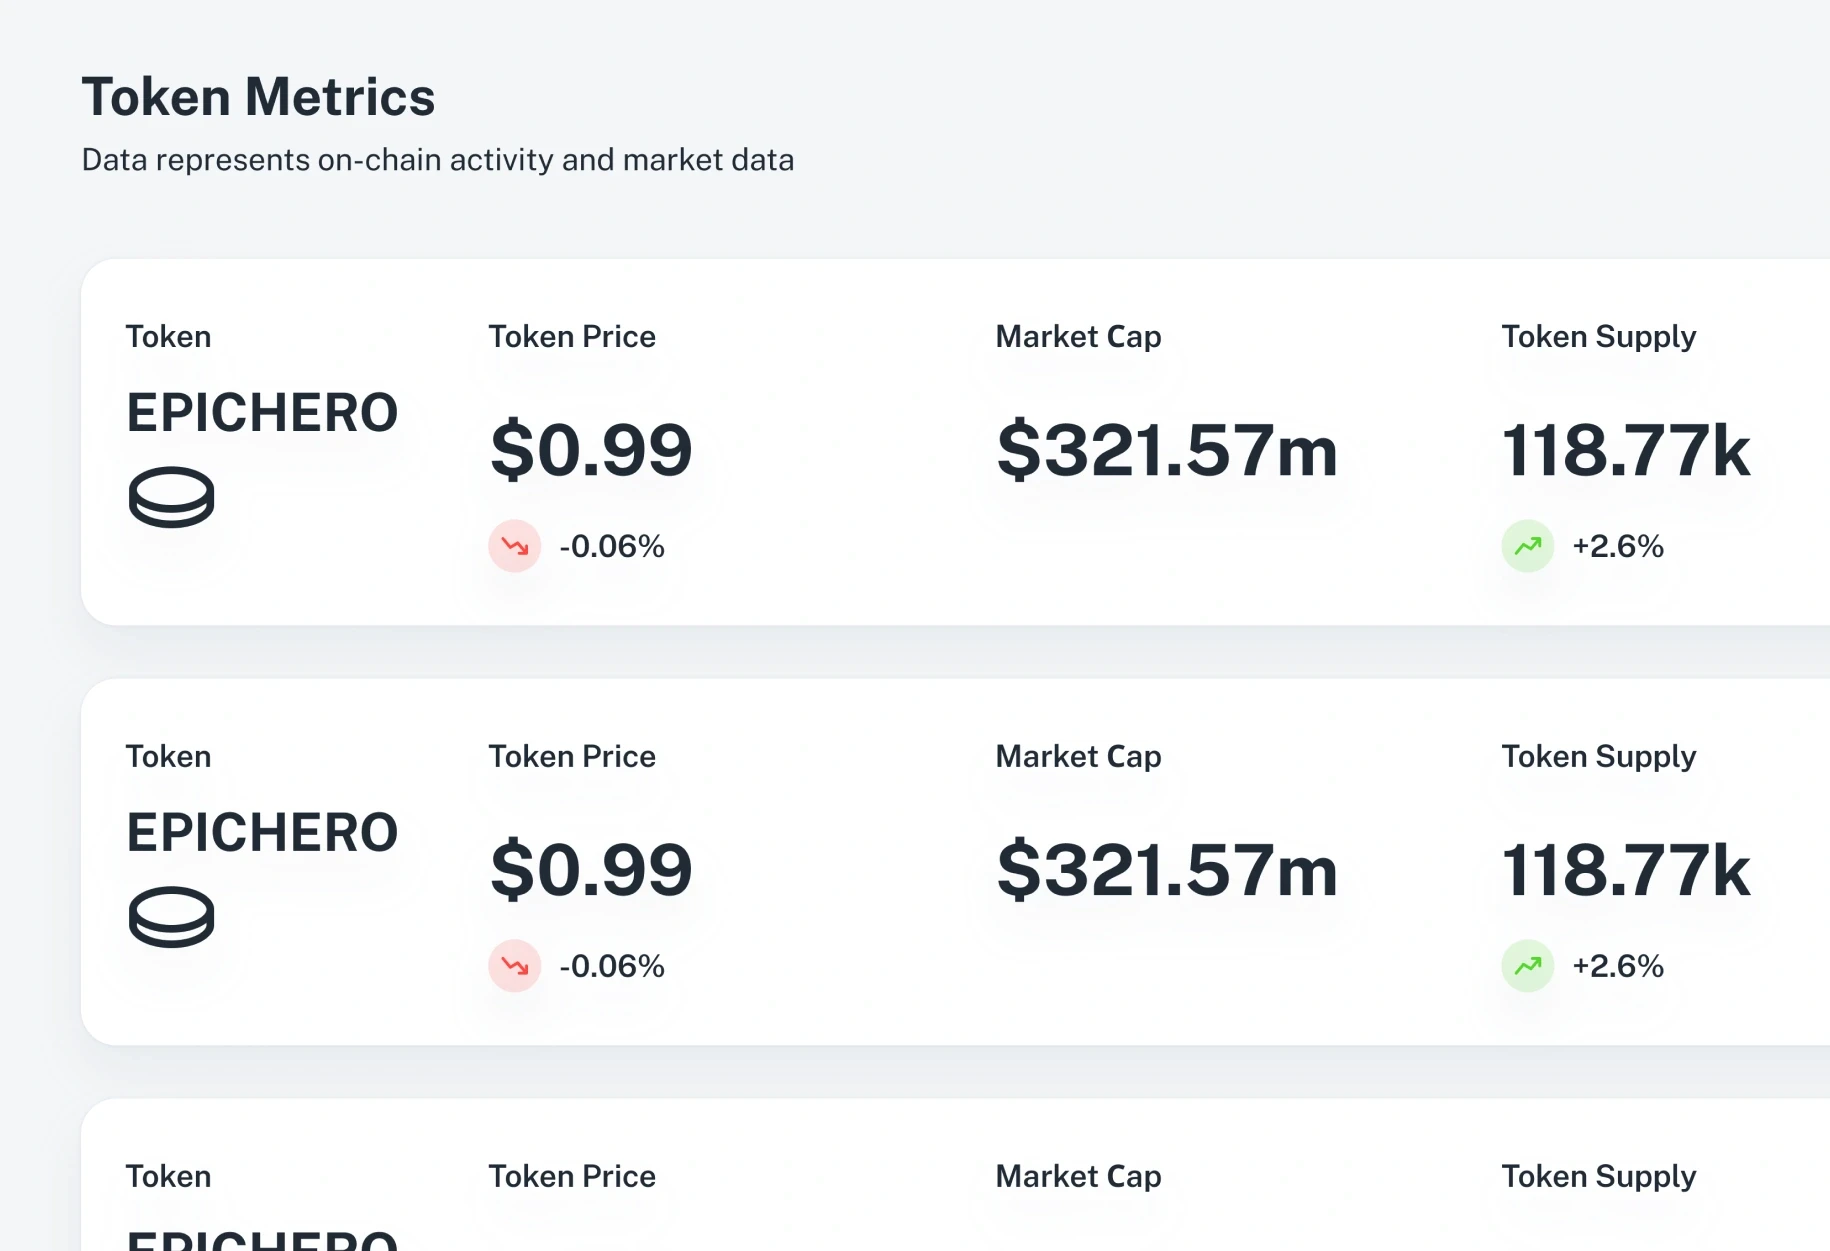
Token Metrics: token, price, market cap and supply for each token, every figure with its change.
Token metricsPrice, market cap, supply and holders, each with its change — read across, like a quote board.

Outcome

What shipped

Status
Shipped
Ranking
Filters by chain, genre, time and stage
Detail
On-chain, social and token metrics
Chains
One project, every chain it runs on

No product metrics were shared for this page, so there are none on it.

Reflection

If I had another two weeks

What I’d test
Whether people sort by balance, users or volume first — the default sort decides what ‘top’ means.
What I’d measure
How often a filter set is cleared and rebuilt. If often, a few saved views would do more than more filters.
What I’d change
Put a small trend line in each row, so growth is visible before the detail page is opened.

End of case 06

Seen enough? Let’s talk about yours.